Stock Market Overvalued? Look at Economic Output
STOCK MARKET OVERVALUED? LOOK AT ECONOMIC OUTPUT
by Paul Cormier, President, Cormier Strategy Advisors Inc.
July 2014
Over time investment in stocks is one of the best ways to participate in economic growth, but in the short run stock prices can be influenced by all kinds of other factors from central bank interest rate policy to corporate stock option policies to general investor sentiment (and a whole lot in between). But over time stocks should “mean revert” to a tracking of economic growth.
In our desire to analyze historical data and trends to inform our clients’ decision making we recently analyzed the relationship between stock prices, economic output (Gross Domestic Product – GDP) and subsequent stock market returns. This simple model, whose results are consistent with what we are seeing in other models, produces some jaw-dropping conclusions.
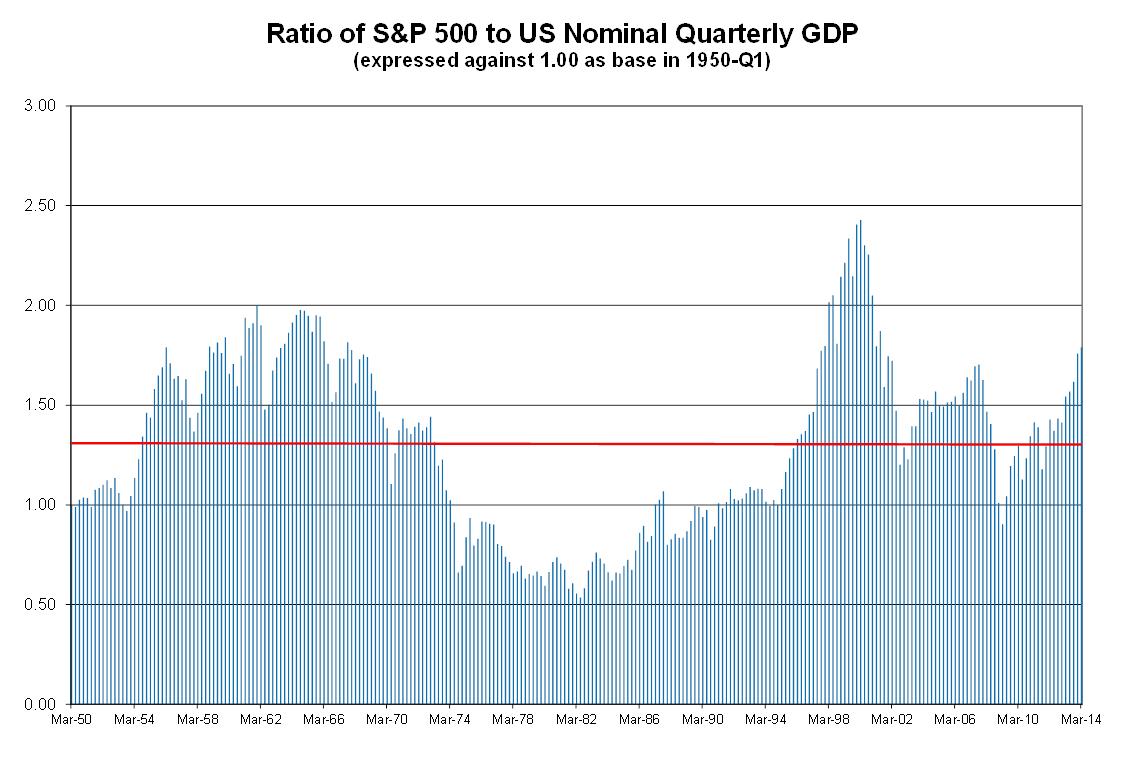
Looking at the US, we started by looking at the ratio of the S&P 500 to US nominal GDP (and then expressed this against a baseline of 1.00 for 1950-Q1). That ratio would tell us the degree to which current stock market valuations were reflecting the size of the economy (a higher ratio would suggest investors were placing a higher valuation on the stock market relative to the size of the economy). The following chart shows the results (the red line is the average over the period so values above the line reflect overvaluation).
But establishing the stock market is over or under valued only matters if it predicts subsequent returns. So we charted 10-year subsequent annualized returns on the S&P 500 against this ratio. The results are presented in the chart below. A pattern certainly is clear. When the market is overvalued using this measure, subsequent 10-year returns are poorer than when the market is undervalued by this ratio, just what we would expect.
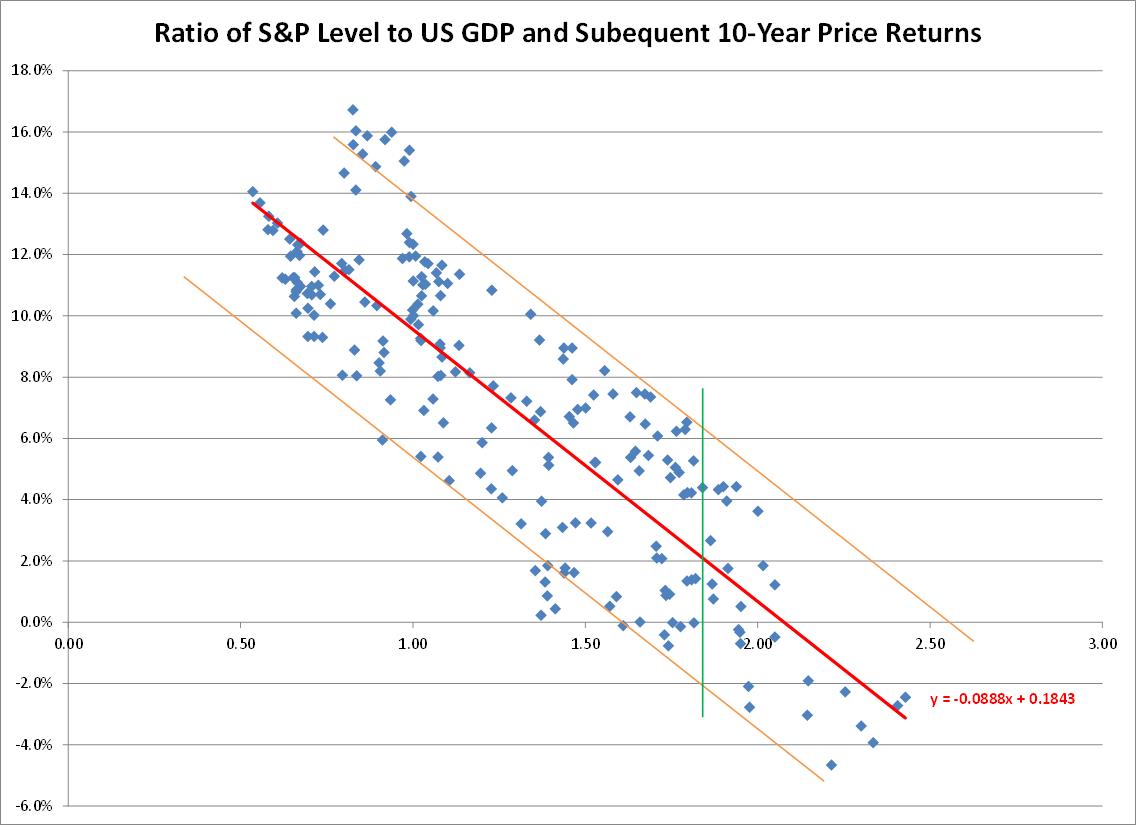
The red trend line will tell us what the expected 10-year annualized market return will be depending on the current ratio of the S&P 500 to US nominal GDP. About 95% of data points fall between the two orange lines giving us a pretty good sense of the range of possible returns.
Official GDP data for 2014-Q2 has not yet been released, but using an estimate of 8% annualized nominal growth in Q2 (2% in the quarter) due to a rebound from weather-related issues in Q1, the ratio would be 1.84, reflected by the green line. Recognizing that past trends are never a guarantee of future results but are a useful guide, we can use this data to predict annualized S&P 500 return for the next 10 years.
| Range of Outcomes |
Price Return |
Dividend Yield |
Total Annualized Return |
| High End |
+6.4% |
+2.0% |
+8.4% |
|
Predicted Outcome |
+2.1% |
+2.0% |
+4.1% |
| Low End |
-2.1% |
+2.0% |
-0.1% |
While this is but a single indicator (and multiple indicators can improve predictive value), this one measure is a good example of general market trends we are seeing. It suggests the S&P 500 will likely return over the next ten years about 4.1% per year (about half from share price growth and half from dividends). This is far below historical averages of about 10% total return in the S&P 500 (about 7% from share price growth and 3% from dividends). Even the high-end of our predicted range of possible outcomes (8.4% total return) based on this measure is below the historical average return. This suggests just how overvalued the stock market has become due to the aggressive policies of the US Federal Reserve. Effectively central bank monetary policy has pushed asset prices so high that it has simply accelerated what would have been future gains to the recent past, reducing future prospects.
Markets don’t move in straight lines and we should expect a bumpy ride – one that is likely to take us lower than current levels at some point. Based on this S&P 500/GDP ratio, the S&P 500 would have to drop by 30% from current levels just to return us to prospects of average historical returns for the next ten years. The vulnerability of the stock market to such a loss or even a deeper loss (markets have a tendency to overreact) is certainly present. It should be noted however that this indicator predicts long-term returns; it does not necessarily follow that a downturn must occur in the near term.
This has some important implications for individual investors and organizations alike. Most individuals see themselves as long-term buy-and-hold investors. Based on expected 10-year return using this one indicator, this is among the 11% of worst times to put new money in the stock market over the last 64 years. A long-term equity investor needs to be willing to expect total returns of only about 4.1% per year for the next ten years and be willing to absorb losses of 30% or more in their equity holdings, based on current levels. If these expectations are not acceptable, they need to reduce equities and raise cash positions (or employ hedging techniques) to shield portfolios and provide available capital to redeploy when expected returns move back to more attractive levels. The indicators monitored by our stock market timing service have also identified market risks and this year the model portfolios informed by those indicators have had a heavy weighting to cash.
For organizations with defined benefit pension plans, this level of predicted return has profound implications. If the US stock market only generates a 4.1% annualized 10-year return and US 10-year treasury bonds return about 2.5%, 10-year annualized return on a balanced portfolio would only be about 3.3% before expenses (it could be less than 3% after expenses). Most funds assume returns in excess of twice that amount (for example, the average expected long-term rate of return for pension funds for S&P 500 companies is 7.1% and for public retirement system funds is 7.7%). Pension funds are likely to see a shortfall against expected investment income. In addition, many pension plans are already underfunded. Of 334 S&P 500 companies with defined benefit pension plans, 88% of cumulative liabilities are covered by assets according to Standard & Poor’s Rating Services, with 29% of company plans below 80% funding levels. Public (government) retirement systems are in much worse shape with only 72% of liabilities covered and a whopping 68% of plans less than 80% funded according to the latest data from Boston College’s Center for Retirement Research. In April 2014, well-known hedge fund Bridgewater Associates warned public pensions are likely to achieve 4% or worse long-term returns on assets, leading to the conclusion that 85% of public pension funds could go bankrupt within three decades. Our research would align to such return projections (at least for the next decade).
Any successful strategy involves understanding where you are and what the environment is likely to throw at you. While this is just but one indicator it gives some good insight on what investors should expect in the years ahead. Investors need to set expectations accordingly and have a plan to protect and capitalize. Expected stock market returns will likely re-emerge at more favourable levels in the future, likely due to a decline in stock prices. The key to capitalizing on that future opportunity is: 1) understanding that the current environment is not particularly attractive for long-term stock price appreciation, 2) adjusting your portfolio construction appropriately and 3) exercising patience to wait for a better day to put your money to work in the stock markets.
Paul Cormier is President of Cormier Strategy Advisors Inc., a firm which provides clients with strategic consulting, project management and short-term management services.